01
Host identity
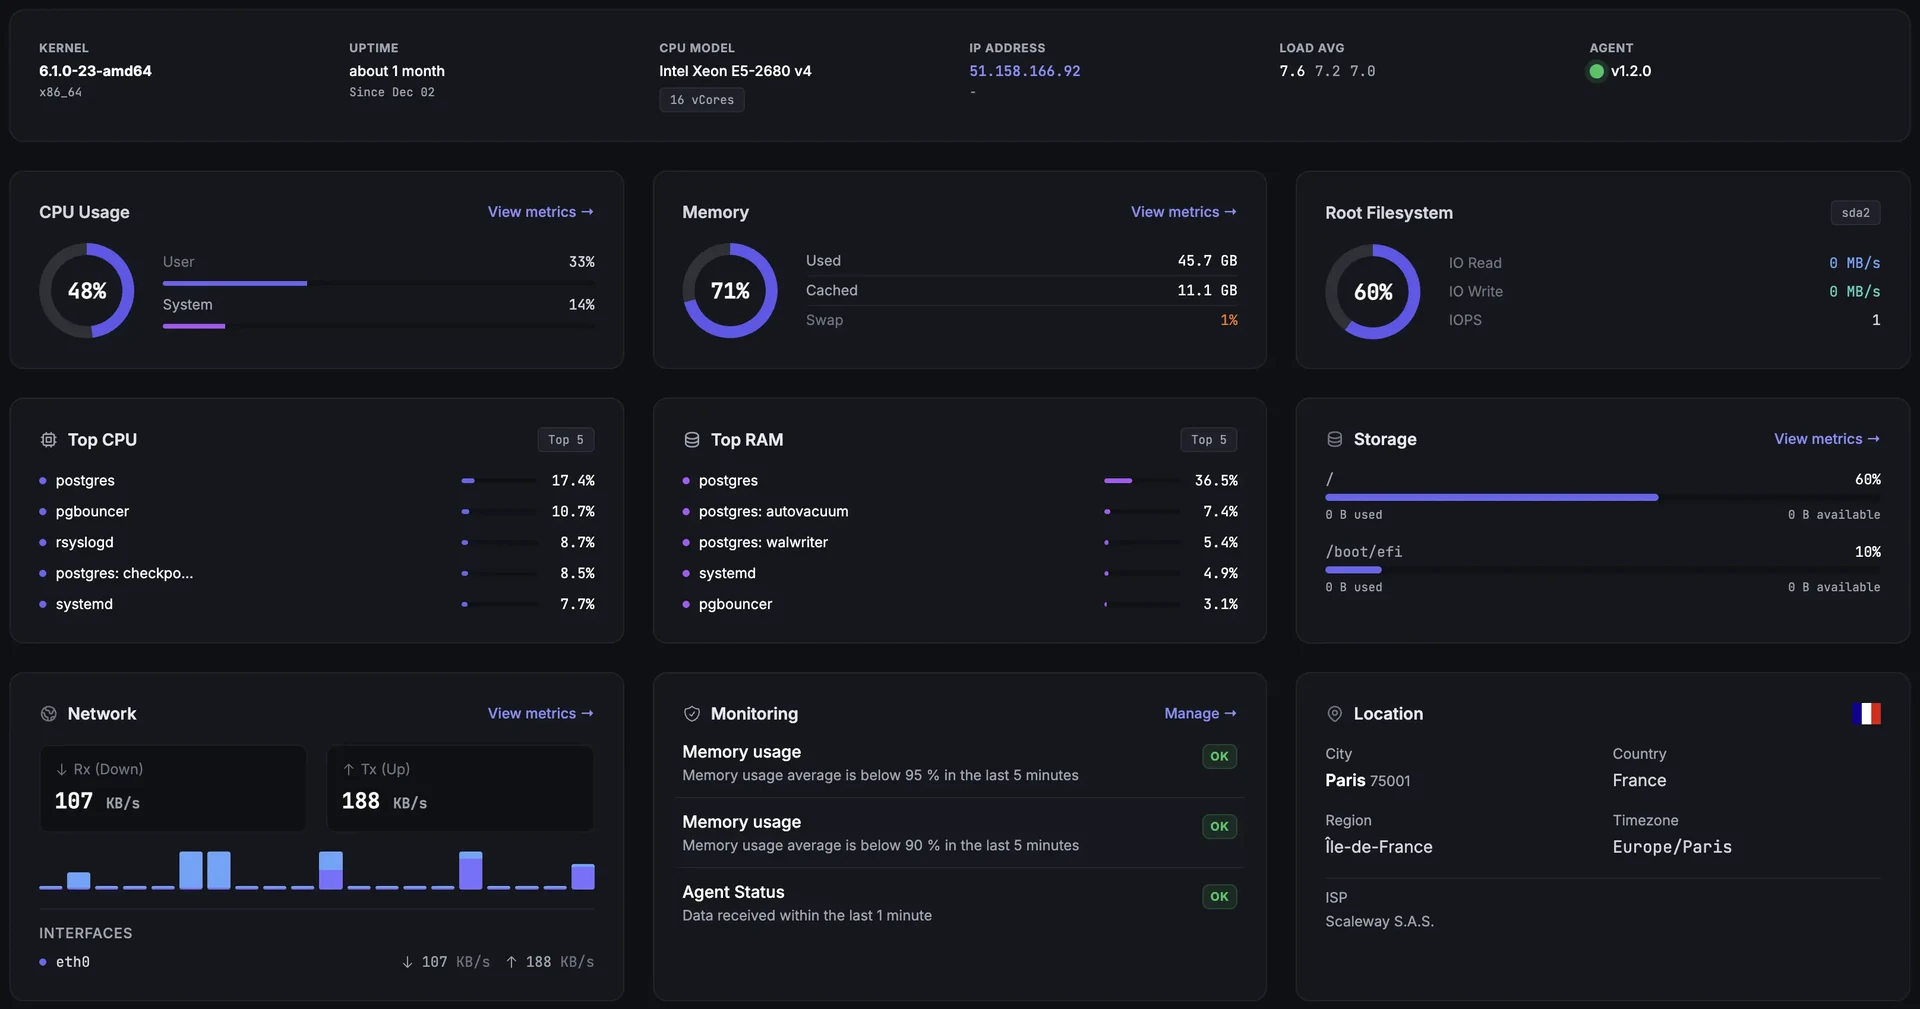
Reads hostname, OS, kernel, CPU architecture, IP addresses, and agent version.
The Fivenines agent is an open-source server monitoring agent that runs on Linux and Windows. It collects infrastructure telemetry locally, then pushes metrics to Fivenines over HTTPS. It is not a remote shell, not an inbound daemon, and not a command-and-control channel.
Open-source agent · HTTPS push model · Optional modules are explicit
The agent runs locally and talks out to Fivenines. Your server does not need to expose an agent port to the internet.
Install
Creates the agent service, local config, and host token.
Collect
Reads metrics and enabled module data from the local host.
Push
Sends telemetry to Fivenines API endpoints over HTTPS.
Config
Gets module settings and intervals back from Fivenines.
Access boundary
The agent sends operational telemetry out to Fivenines. It does not open a control path back into your server.
Your server
Fivenines agent
Reads local host and enabled module data.
metrics · process names · package versions
HTTPS · Outbound only
No inbound agent port
Fivenines
Telemetry API
Receives operational telemetry pushed by the agent.
dashboard · alerts · module config
What the agent does
01
Reads hostname, OS, kernel, CPU architecture, IP addresses, and agent version.
02
Collects CPU, load, memory, swap, disk I/O, partitions, network counters, and temperatures.
03
Reports top process names by CPU and memory usage for troubleshooting.
04
Can send open ports and OS package names and versions for vulnerability matching. Package inventory runs on Linux today; on Windows the agent reads disk health through WMI instead, and software inventory stays off until Windows vulnerability matching ships.
05
Everything below is off until you turn it on. Containers and virtualization: Docker, container image packages, QEMU/KVM, Proxmox. Databases and caches: PostgreSQL, MySQL/MariaDB, Redis/Valkey, Memcached, RabbitMQ. Web and runtime: NGINX, Apache, Caddy, HAProxy, PHP-FPM. Storage: Ceph, ZFS, RAID, S.M.A.R.T. System: systemd units, Fail2ban, NVIDIA GPU. AI inference: vLLM and SGLang serving health. Network and VPN: SNMP devices, MQTT brokers, WireGuard, OpenVPN, Tailscale. Monitoring stack: Prometheus and VictoriaMetrics server health.
06
Most are a per-host toggle in your dashboard. Three work differently and are worth knowing: SNMP devices and MQTT brokers are enabled by adding the device or broker and naming which agent polls it, so that agent starts polling without a switch on the host itself; and container image package inventory rides the Docker toggle on Pro and above rather than having its own.
07
Two optional modules read journald content, both off by default and both Linux-only. Log monitoring reads the systemd units you allowlist. Systemd service monitoring additionally captures a short journal tail (at most a few lines) for a unit at the moment it FAILS, so the alert can show you why. See the section below for exactly what each one reads and sends.
08
Supports user-level install; deeper modules use explicit local access such as Docker socket, read-oriented API tokens, database monitoring views, journal group membership, or constrained sudoers commands.
Log monitoring
Every other module reads metrics and operational state. Two read journal content, so here is precisely what they read, when, and what leaves your server.
Log monitoring ships disabled on every host. Nothing in journald is read for it until an operator turns it on and lists the units to watch.
The agent reads only the systemd units you name, up to 12 per host. The allowlist is re-checked on the server before every capture is issued and again when the result is uploaded, so removing a unit stops new captures and refuses any late upload for it.
Secret and PII masking runs on your server before anything is sent. Masking is best effort, so treat it as a safety net rather than a guarantee, and keep units that log sensitive payloads off the list.
Between incidents the agent sends per-unit error and warning rates plus a short redacted sample line for each distinct error pattern, so you get a signal without shipping a log stream.
When an incident opens, the agent reads the recent journal for those units locally and uploads a bounded digest: severity counts plus a capped set of error patterns, each with one masked excerpt of at most a few hundred characters. The journal itself never leaves the machine, and we never store a raw copy of it.
Captured digests carry a 30 days retention stamp and are purged by a nightly sweep once it passes, so the practical ceiling is that window plus up to a day. Turning the module off stops new captures at once; a capture already handed to the agent can still run locally until it expires, and its upload is refused.
Systemd service monitoring is a separate toggle, and it also touches the journal: when a unit FAILS it captures a short journal tail, at most a few lines and truncated, so the alert can show why. It is captured once per failure rather than continuously. If you want no journal reads at all, leave both modules off.
Opt-in · Linux and journald only · Redacted before upload · Deleted after 30 days
The agent is open source, the install path is documented, and the permission model is explicit. Start with the live demo or create a trial when you want to test it on a real server.
No credit card · User-level install available · Optional modules are explicit