Custom Dashboards - Your Metrics, Your Layout, Zero Config Files
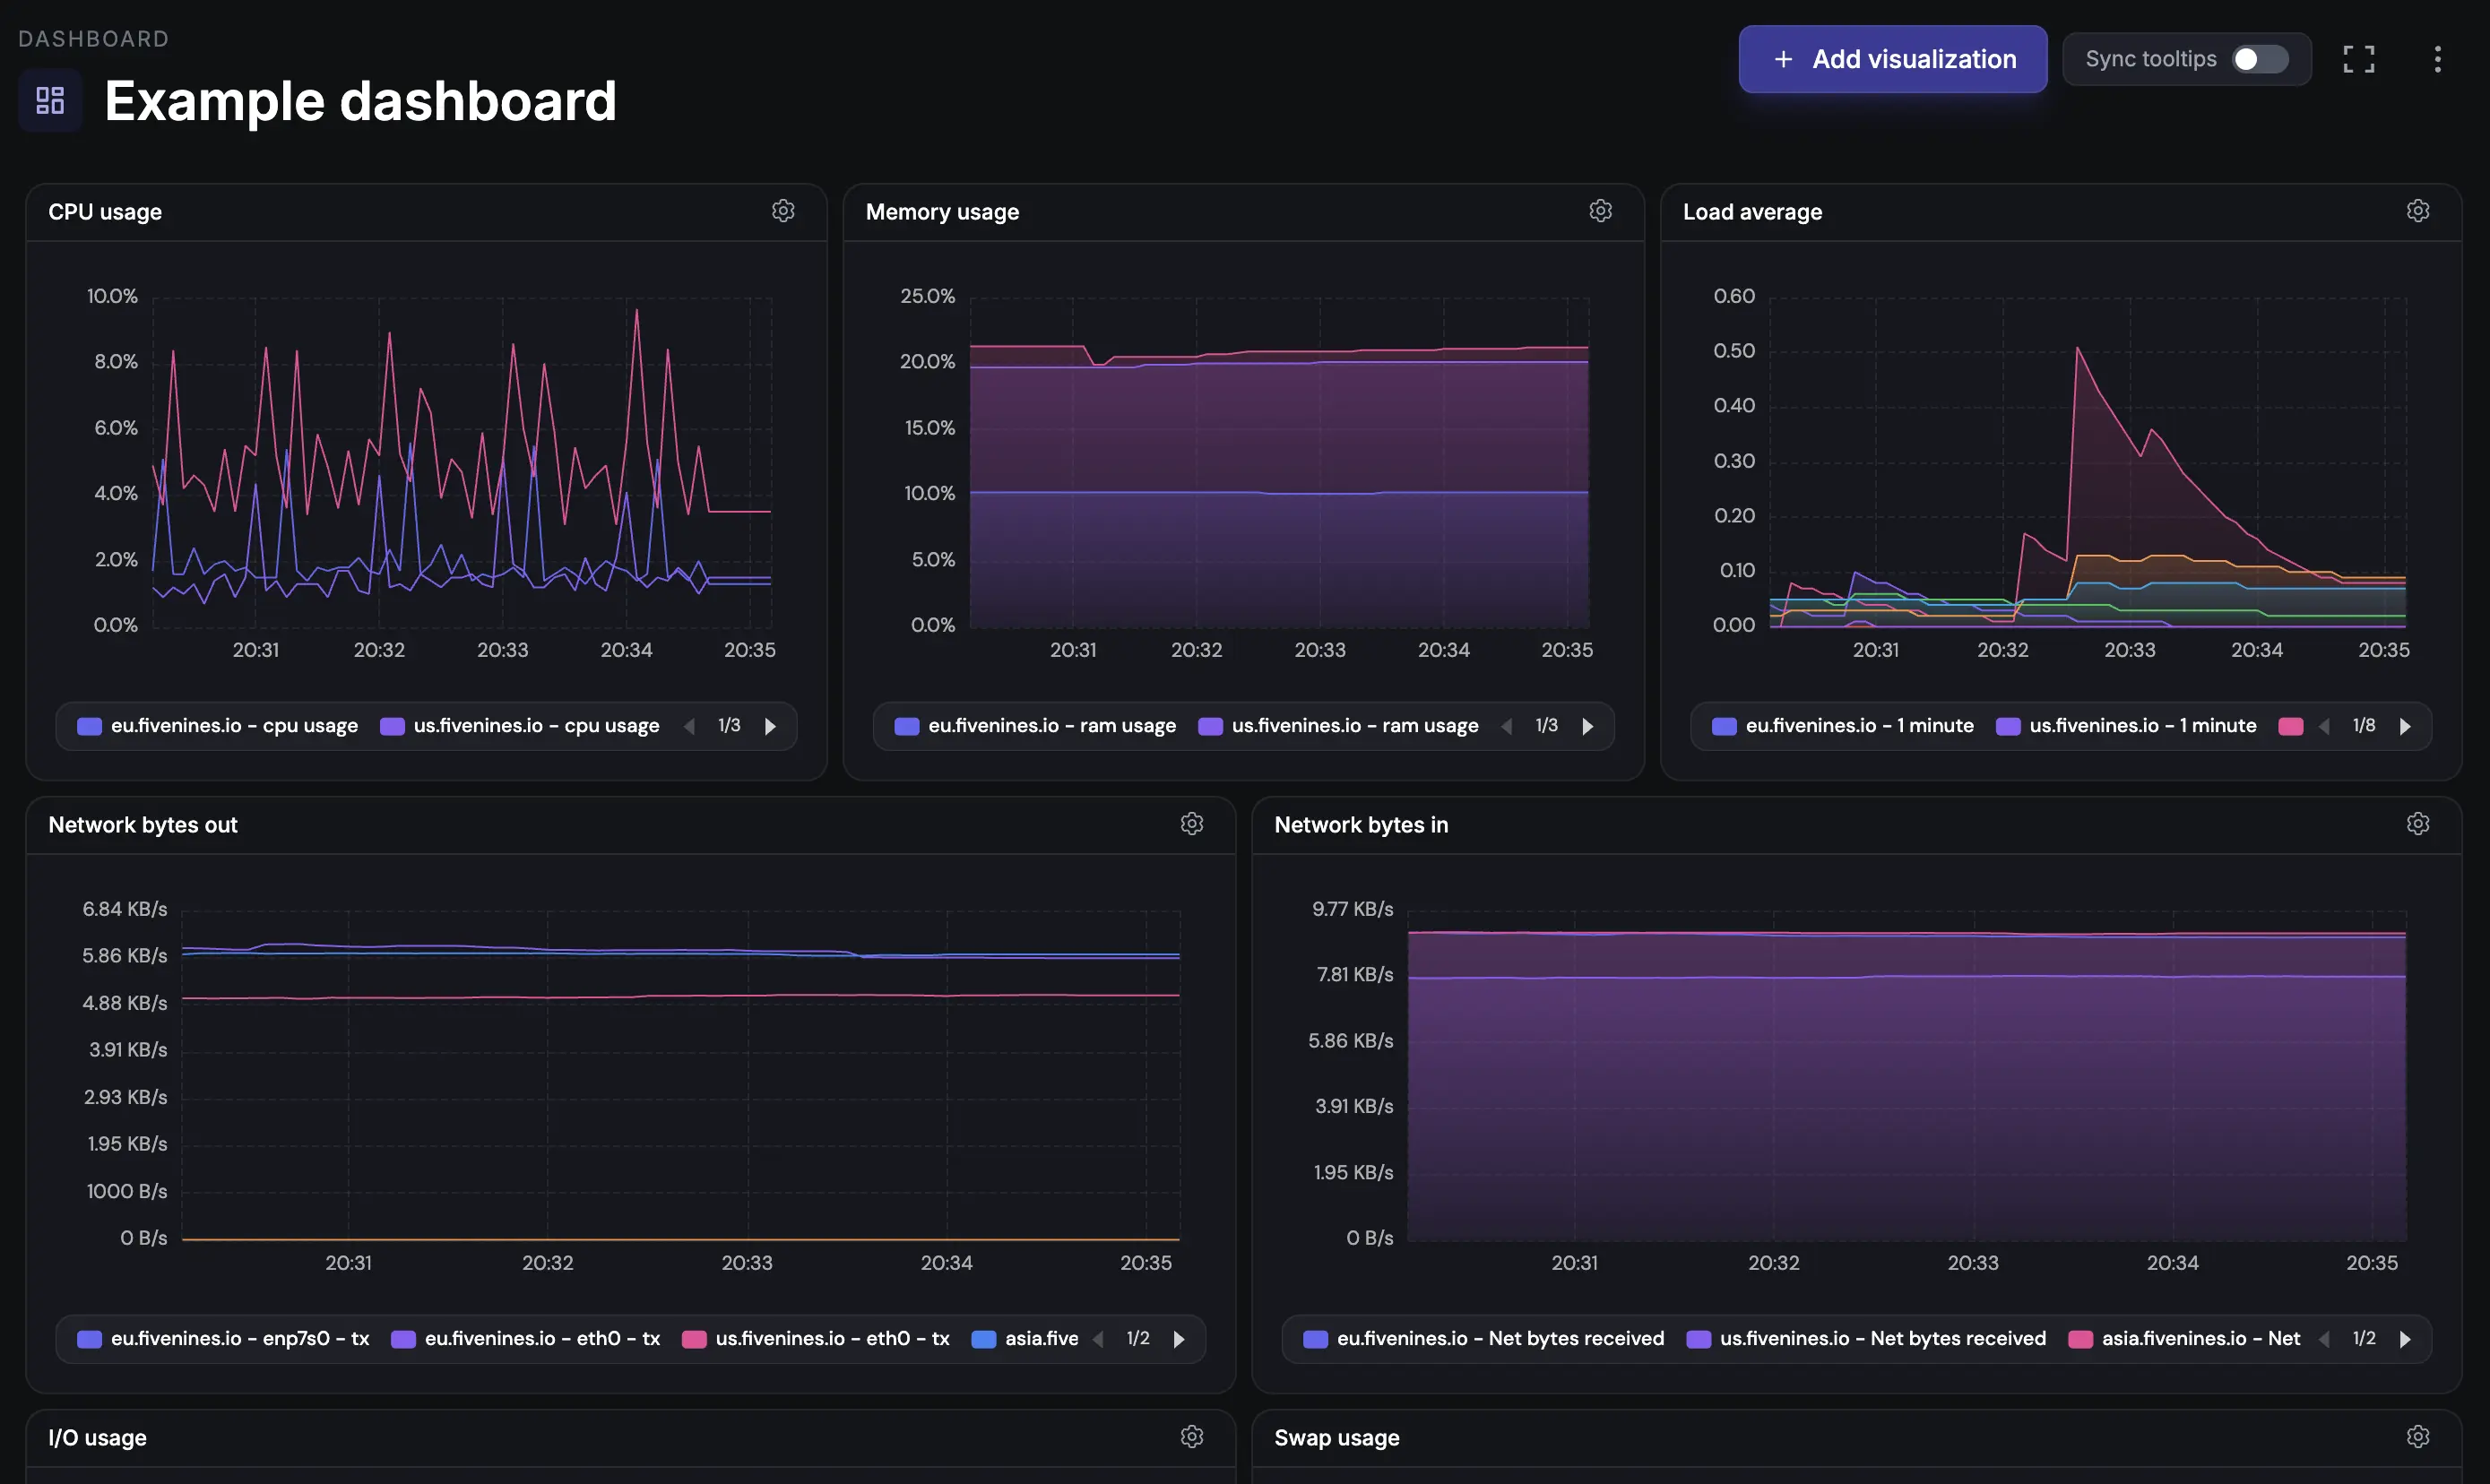
Start from one of 18 ready-made templates and have a populated dashboard in a single click, or build your own from 200+ metrics across ten panel types. No query language required.
Built for teams monitoring production infrastructure
No credit card · 2-minute setup
-
One-Click Templates
18 ready-made dashboards covering fleet health, databases, web servers, containers, storage and more. Pick the servers it applies to, click once, and the panels are already laid out.
-
Ten Panel Types
Line, area and bar charts. Stat and gauge panels. Top N, pie and table rankings. State timeline and uptime heatmap for availability. One dashboard, whatever shape the question is.
-
Shareable Public Links
Generate a public link for any dashboard. Share with your team, clients, or embed it in your wiki. No login required for viewers.
Deep dive
Start From a Template, Not a Blank Grid
The template gallery ships 18 ready-made dashboards. Search it, filter by category, and click once - the dashboard is created with every panel already sized and placed.
Before it builds, you choose which entities it applies to. A fleet of 50 servers does not have to mean 50 lines on every chart: pick the servers, uptime monitors, tasks, network devices or Ceph clusters you actually want, and rename the dashboard while you are there.
Templates only create panels that will have data. If a template covers RAID, S.M.A.R.T. and ZFS but you only run ZFS, the panels that would read "No data" are dropped and you are told how many and why.
Overview and instances
Fleet health, Linux host vitals, Windows host vitals, capacity planning
Databases
PostgreSQL, MySQL, Redis
Web and containers
Web server, PHP-FPM, containers and services
Storage and virtualization
Proxmox, ZFS pools, storage health, Ceph cluster
Network and hardware
SNMP network devices, NVIDIA GPU
Uptime and security
Uptime and SLA, security posture
Already curated a dashboard you like? Add a template to it as a new collapsible section instead of creating a second dashboard. Everything you already built stays exactly where it is.
Ten Panel Types, Filtered to What Fits
Line, area, bar
Trends over time. Stack them, or overlay incidents so an outage is shaded straight onto the chart.
Stat, gauge
One number for the window - current value, average, min or max, collapsed across every server on the panel.
Top N, pie, table
Ranking and breakdowns. Which five servers are hottest, which pool is fullest, which host carries the most vulnerabilities.
State timeline, uptime heatmap
Availability history from your incident record, not from a metric - the up/down story of a server, monitor or task.
Not Just Servers
Servers
CPU, memory, disk, network, plus every integration you have enabled - Docker, PostgreSQL, MySQL, Redis, Nginx, Caddy, Apache, PHP-FPM, ZFS, RAID, S.M.A.R.T., NVIDIA GPU, Proxmox and more.
Uptime monitors
Response time, availability, and days remaining before the TLS certificate expires.
Cron and heartbeat tasks
Availability of the scheduled jobs you already track, on the same board as the servers they run on.
SNMP network devices
Per-interface throughput, packets, errors, discards and link status for switches, routers and firewalls.
Ceph clusters
OSD and monitor counts, placement group health, capacity, client I/O and recovery progress.
Your whole organization
Incident count, MTTR and MTTA over any window, plus vulnerability counts across the fleet - including the patchable subset.
Deep dive
Built for Boards You Actually Keep Open
Panels drop onto a 24-column grid, so two, three or four across all line up cleanly. Drag them between groups, resize them, and let the layout save itself.
Group related panels into collapsible sections - a Grafana-style row - and collapse the ones you are not looking at today. A collapsed section does not run its queries until you open it, so a long dashboard stays fast.
Turn on auto-refresh and the panels keep following now, every 30 seconds on a short window, and the switch says so when a refresh fails. Hit fullscreen for the wall display. Hover one chart and the matching timestamp lights up on the others, so you can line up a spike across panels without guessing.
Zoom into a five-minute window to investigate an incident, or zoom out across the 24 months of metric history every plan keeps. Export a time-series chart as a PNG when you need it in a report or a ticket.
Panels that read your incident record - availability, incident count, MTTR and MTTA - come from the same incidents your alerts opened, so the dashboard and the incident list can never disagree.
What Teams Use Public Dashboards For
Client reporting
Share a live performance snapshot with stakeholders instead of a monthly screenshot
Team visibility
Put a dashboard on the office TV for at-a-glance monitoring
Embedded views
Drop the public link into a wiki, a runbook, or a Slack channel - no login required
How It Compares
| Feature | Grafana | Datadog | Fivenines |
|---|---|---|---|
| Setup time | Hours (+ Prometheus) | 30 min | 2 min |
| Query language required | PromQL | DQL | None |
| Populated templates out of the box | Import JSON | Integration-scoped | 18, one click |
| Drag-and-drop builder | Limited | ||
| Public sharing | Plugin required | Paid add-on | Built-in |
| Starting price | Free (self-hosted) | $15/host/mo | 14-day trial |
Frequently Asked Questions
What panel types are available? +
Do I have to build every dashboard from scratch? +
What can I put on a dashboard? +
Can other team members edit dashboards, and can I share one publicly? +
Is there an API for dashboards? +
Explore next
Related Features
Uptime Monitoring
Chart response time, availability and SSL expiry for any monitor on the same dashboard.
Explore ->Network Device Monitoring
Put per-interface SNMP throughput and link status next to your server metrics.
Explore ->Docker Monitoring
Visualize per-container CPU, memory, and network metrics in your dashboards.
Explore ->Server Alerts
Set thresholds on dashboard metrics and get notified via multiple channels.
Explore ->See how Fivenines compares to other tools
Read our guide to the best infrastructure monitoring tools in 2026.
Build your first dashboard in 2 minutes
14-day trial. No credit card required.
No credit card · 2-minute setup · Cancel anytime