Monitoring Workflows & Automation
Stop writing one-off scripts to handle alerts. Build monitoring automation visually - drag triggers, conditions, and actions onto a canvas, connect them, and publish. When a server goes down at 3 AM, your workflow handles the first 5 minutes of incident response before anyone wakes up.
Built for teams monitoring production infrastructure
No credit card · 2-minute setup
How It Works
Step 1
Choose a Trigger
48 types, searchable: instance and container health, Postgres, MySQL, RAID, ZFS, Ceph, CVEs, SSL expiry, missed cron jobs, SNMP, MQTT, Proxmox, and more.
Step 2
Add Logic
Conditions to filter by instance or service, delays to wait, rechecks to confirm the issue is not a transient spike.
Step 3
Gate the Escalation
Route on business hours, stay quiet during maintenance, throttle repeats, suppress alerts on an already-down host, branch by severity.
Step 4
Publish
Notify via Slack, Microsoft Teams, PagerDuty, email and more, and open the incident. Every publish is versioned; every run is logged.
-
Visual Drag-and-Drop Builder
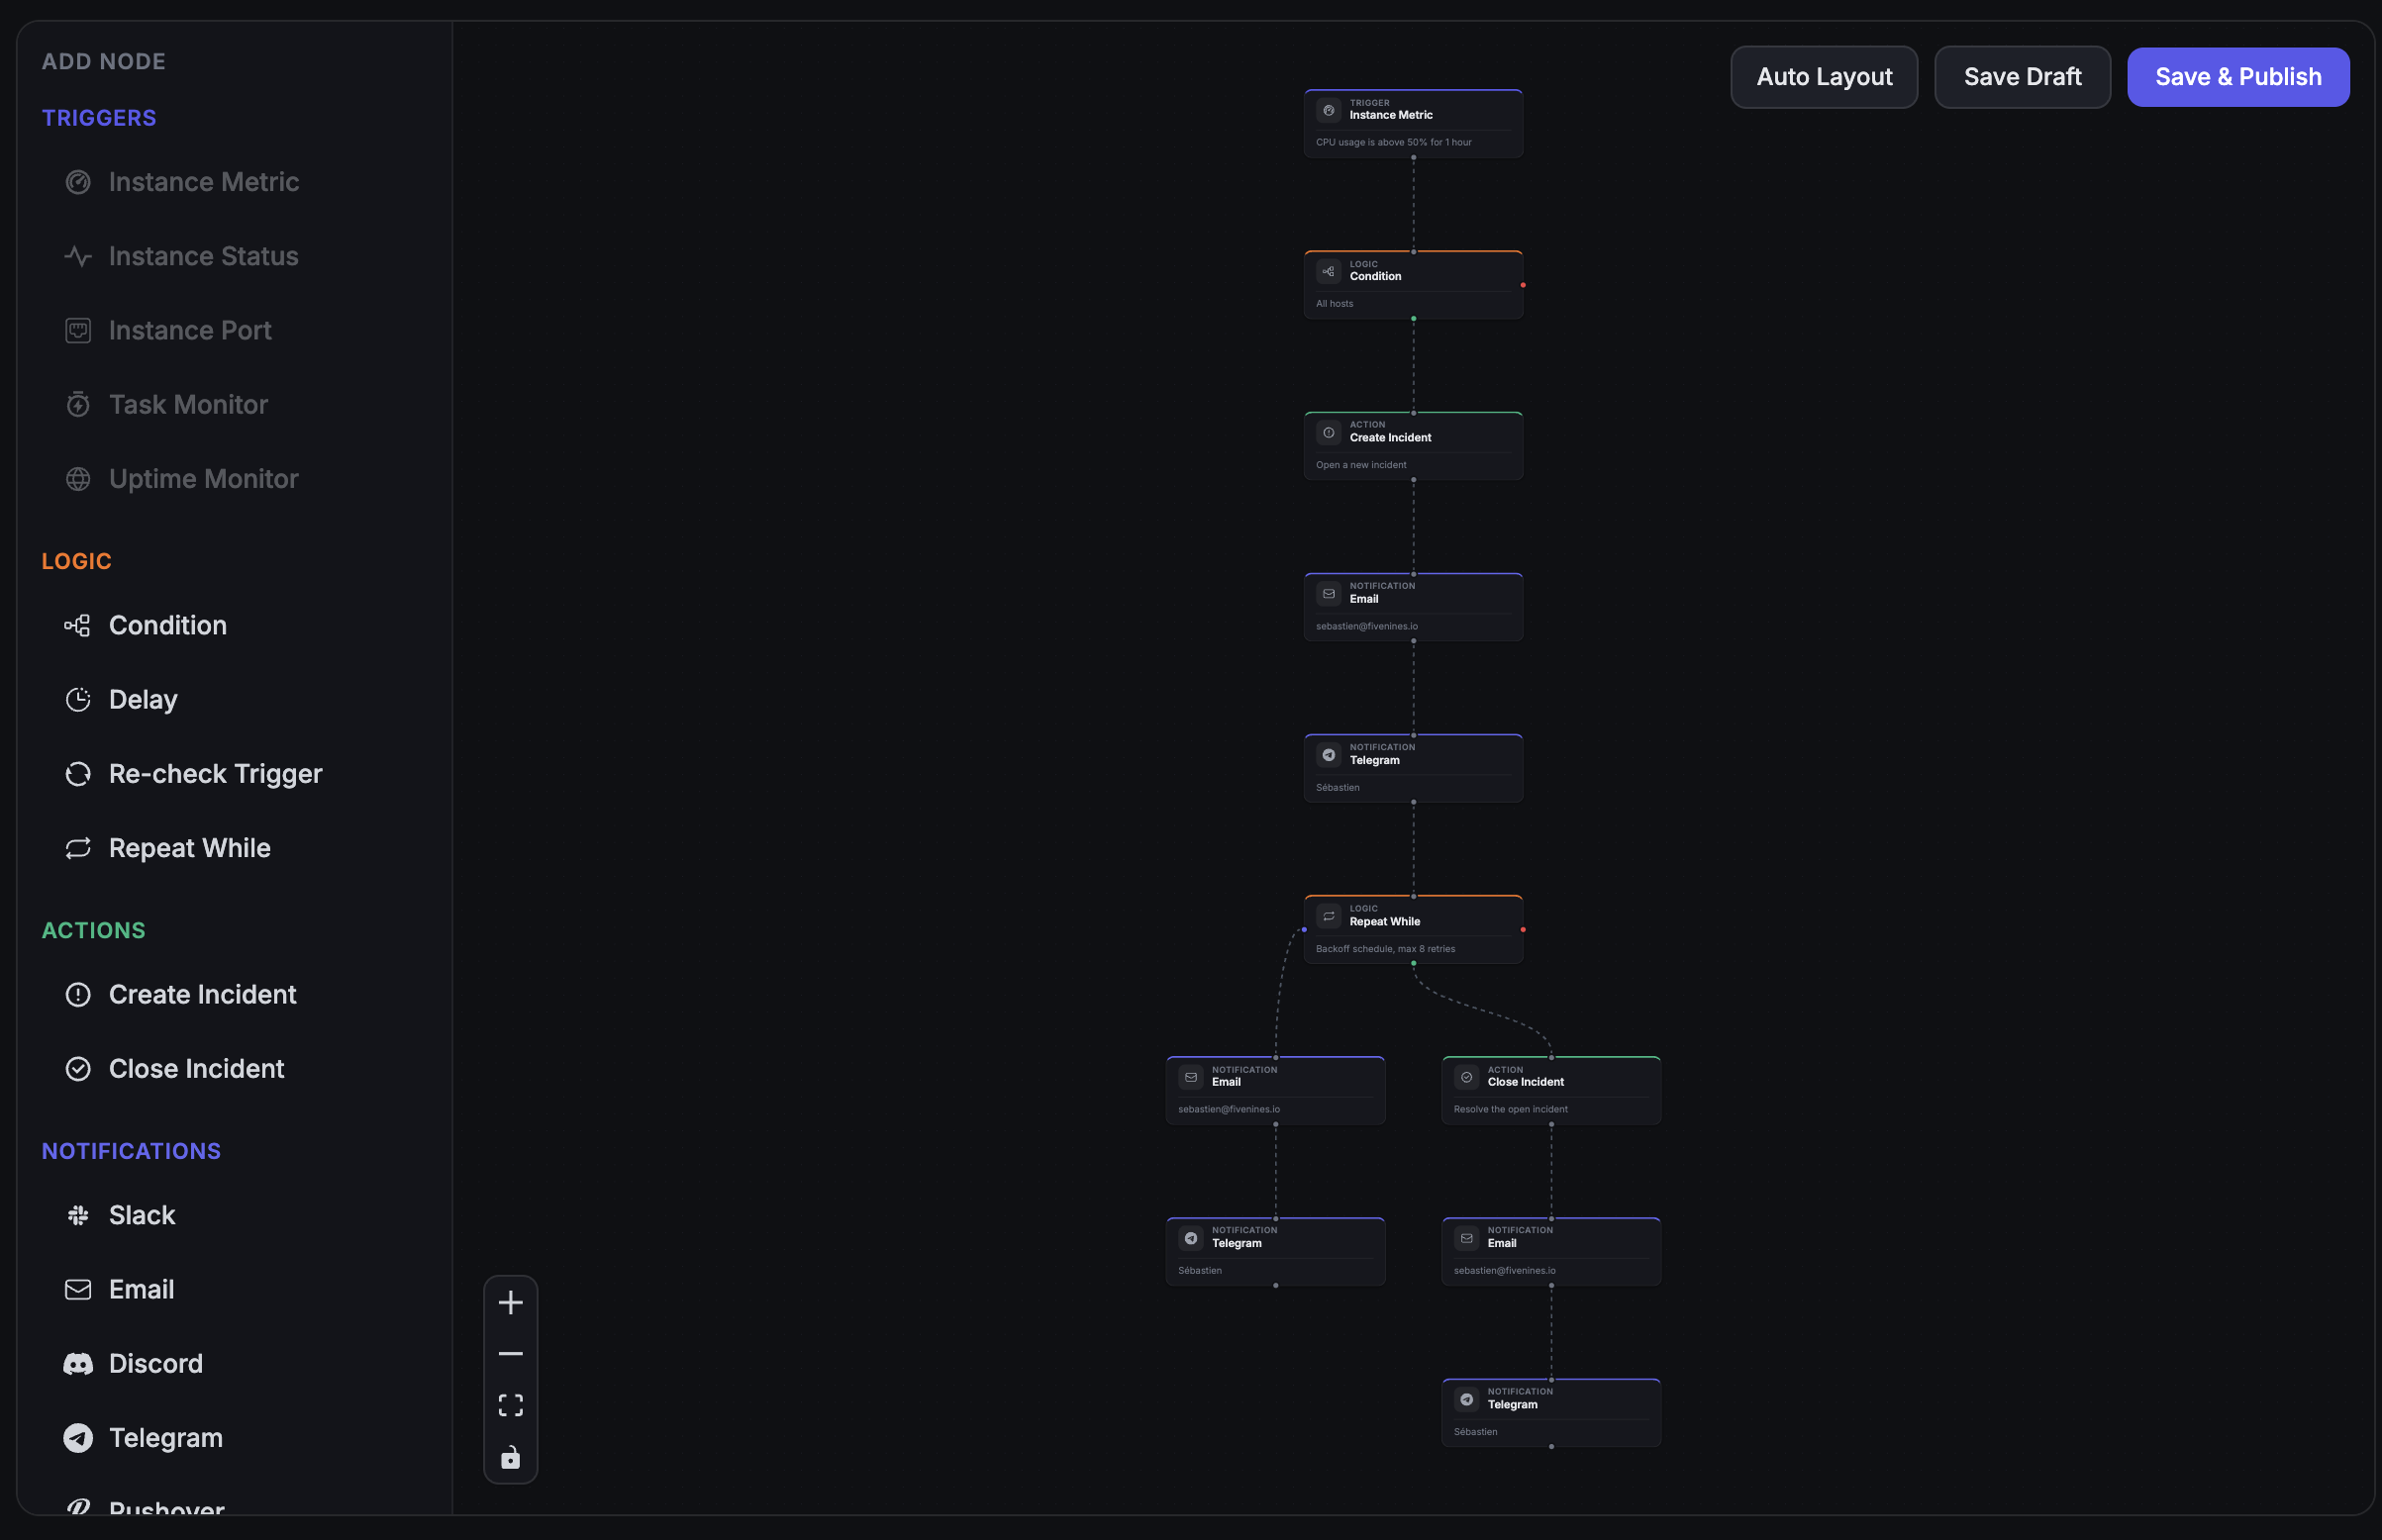
A React canvas where you build workflows by connecting nodes, drawn from a catalog of 76 node types. Search the palette by name or keyword to find the one you need. No YAML, no scripting, no DSL to learn - the entire logic path is visible at a glance.
-
55 Trigger Types, One Engine
Everything you monitor can start a workflow: databases, containers, RAID and ZFS arrays, CVEs, certificates, SNMP devices, MQTT topics, Proxmox clusters, GPUs, vLLM and SGLang inference servers. Recheck nodes re-evaluate the trigger after a delay so a transient spike never pages anyone.
-
Escalation Without a Second Vendor
Business-hours routing, maintenance suppression, cooldowns, and severity branching are logic nodes on the same canvas - not a separate on-call product with its own per-seat bill. Create Incident and Close Incident nodes handle the full lifecycle onto your status page.
Deep dive
Visual Workflow Builder
The workflow builder is a full React application embedded in your dashboard. Drag nodes from the sidebar, drop them on the canvas, and connect them with edges. Each node has a configuration panel where you set thresholds, choose notification channels, or write condition logic.
The canvas shows you the entire execution path. Follow the flow from trigger to notification to incident creation. When a workflow runs, each node lights up with its result - passed, failed, or skipped.
Deep dive
76 Node Types in Four Categories
Every workflow is assembled from the same four kinds of node:
- 55 Triggers: instance status, TCP ports, and metric thresholds; systemd units; Docker container state and restart loops; PostgreSQL, MySQL, and Galera clusters; RabbitMQ backlogs; HAProxy backends; PHP-FPM saturation; RAID, SMART, ZFS, and Ceph; Proxmox clusters, nodes, guests, storage, and guest backups; Proxmox Backup Server health; QEMU guests; SNMP devices and interfaces; uptime, response time, SLA breaches, SSL expiry, and DNS record changes; missed cron jobs, heartbeats and reported job failures; CVEs and fail2ban bans; temperature sensors and NVIDIA GPUs; vLLM and SGLang inference servers; WireGuard peers and OpenVPN clients; MQTT topics; Prometheus and VictoriaMetrics health; incident lifecycle; agent version and quota.
- 11 Logic nodes: Condition (if/else branching), Delay, Recheck Trigger, Repeat While, and the seven escalation gates below.
- 8 Notification channels: Email, Slack, Microsoft Teams, Telegram, Discord, Pushover, PagerDuty, and Webhooks.
- 2 Actions: Create Incident and Close Incident.
Each node type can be used as many times as you need. Branch the graph to route different failures to different teams, and use as many workflows as you want - there is no per-workflow charge on any plan.
Deep dive
Escalation Gates: The Part That Keeps 3 AM Quiet
Most monitoring tools give you a threshold and a webhook, then sell on-call routing as a second product. In Fivenines the escalation logic is seven nodes you drop on the same canvas:
- Schedule Gate: branch on time of day and day of week. Page during business hours, queue an email overnight - or the reverse for a night-shift rota.
- Maintenance Gate: branch on whether the host is in a maintenance window, so planned work does not wake anyone.
- Cooldown: suppress repeat pass-throughs inside a time window. One page per incident, not one per evaluation cycle.
- Dependency Gate: suppress a service alert when the host itself is down. You get one 'server is down', not forty 'the database, the queue, and the proxy are unreachable'.
- Severity Router: branch on the alert's severity, including the CVSS score on a vulnerability trigger.
- Incident Count Gate: branch on how many incidents the host has opened recently, to catch a flapping server.
- Acknowledgement Gate: branch on whether anyone has acknowledged the incident yet. Ten minutes of silence and the whole team gets the email - the escalation everyone wants and nobody wants to build twice.
Combine them: a critical CVE routes to PagerDuty immediately, while a medium one waits for business hours and lands in Slack - and neither fires while the box is in maintenance.
Deep dive
64 One-Click Templates
You do not have to start from an empty canvas. The template gallery ships 64 pre-built workflows across 18 categories - instance metrics, uptime, databases, containers, storage, network, security, hardware, virtualization, queues, IoT, incident escalation, and more. Search it by name, pick one, and it lands on your canvas fully wired with trigger, conditions, and notification already configured.
Templates are a starting point, not a cage. Every node stays editable, so you can change the threshold, add a schedule gate, or swap the notification channel before you publish.
How It Compares
| Approach | Visual Builder | Escalation Policies | Incident Creation | Delay / Recheck | Cost |
|---|---|---|---|---|---|
| Static Alerts | Varies | ||||
| PagerDuty | $21+/user/mo | ||||
| Datadog | $15+/host/mo | ||||
| Fivenines | Built-in | Built-in | Built-in | From €19/mo |
Included on all plans
Unlimited workflows, no per-workflow charge. 55 trigger types, 64 templates, 7 escalation gates in the box.
Channel availability varies by plan - see pricing.
Frequently Asked Questions
What trigger types are available? +
Can I build escalation policies without a separate on-call tool? +
Are there pre-built workflows I can start from? +
Which notification channels can a workflow use? +
Can workflows create incidents automatically? +
How does the recheck logic work? +
Are workflows versioned? +
How many workflows can I create? +
Explore next
Related Features
Server Alerts
Workflows power all alerting in Fivenines. Configure thresholds and notification channels visually.
Explore ->Cron Job Monitoring
Use the Task Monitor trigger to alert when scheduled jobs fail or run late.
Explore ->Uptime Monitoring
Combine uptime triggers with workflow logic for sophisticated incident response.
Explore ->See how Fivenines compares to other tools
Read our guide to the best infrastructure monitoring tools in 2026.
Build your first monitoring workflow in 5 minutes
14-day trial. No credit card required.
No credit card · 2-minute setup · Cancel anytime