Docker Monitoring That Tells You Why the Container Died
Per-container CPU, memory, network and block I/O - plus the state a graph cannot show you: exit code, OOM kill, HEALTHCHECK verdict and restart-loop churn. No Prometheus, no cAdvisor, no Grafana dashboards to maintain.
Built for teams monitoring production infrastructure
No credit card · 2-minute setup
-
Per-Container Metrics
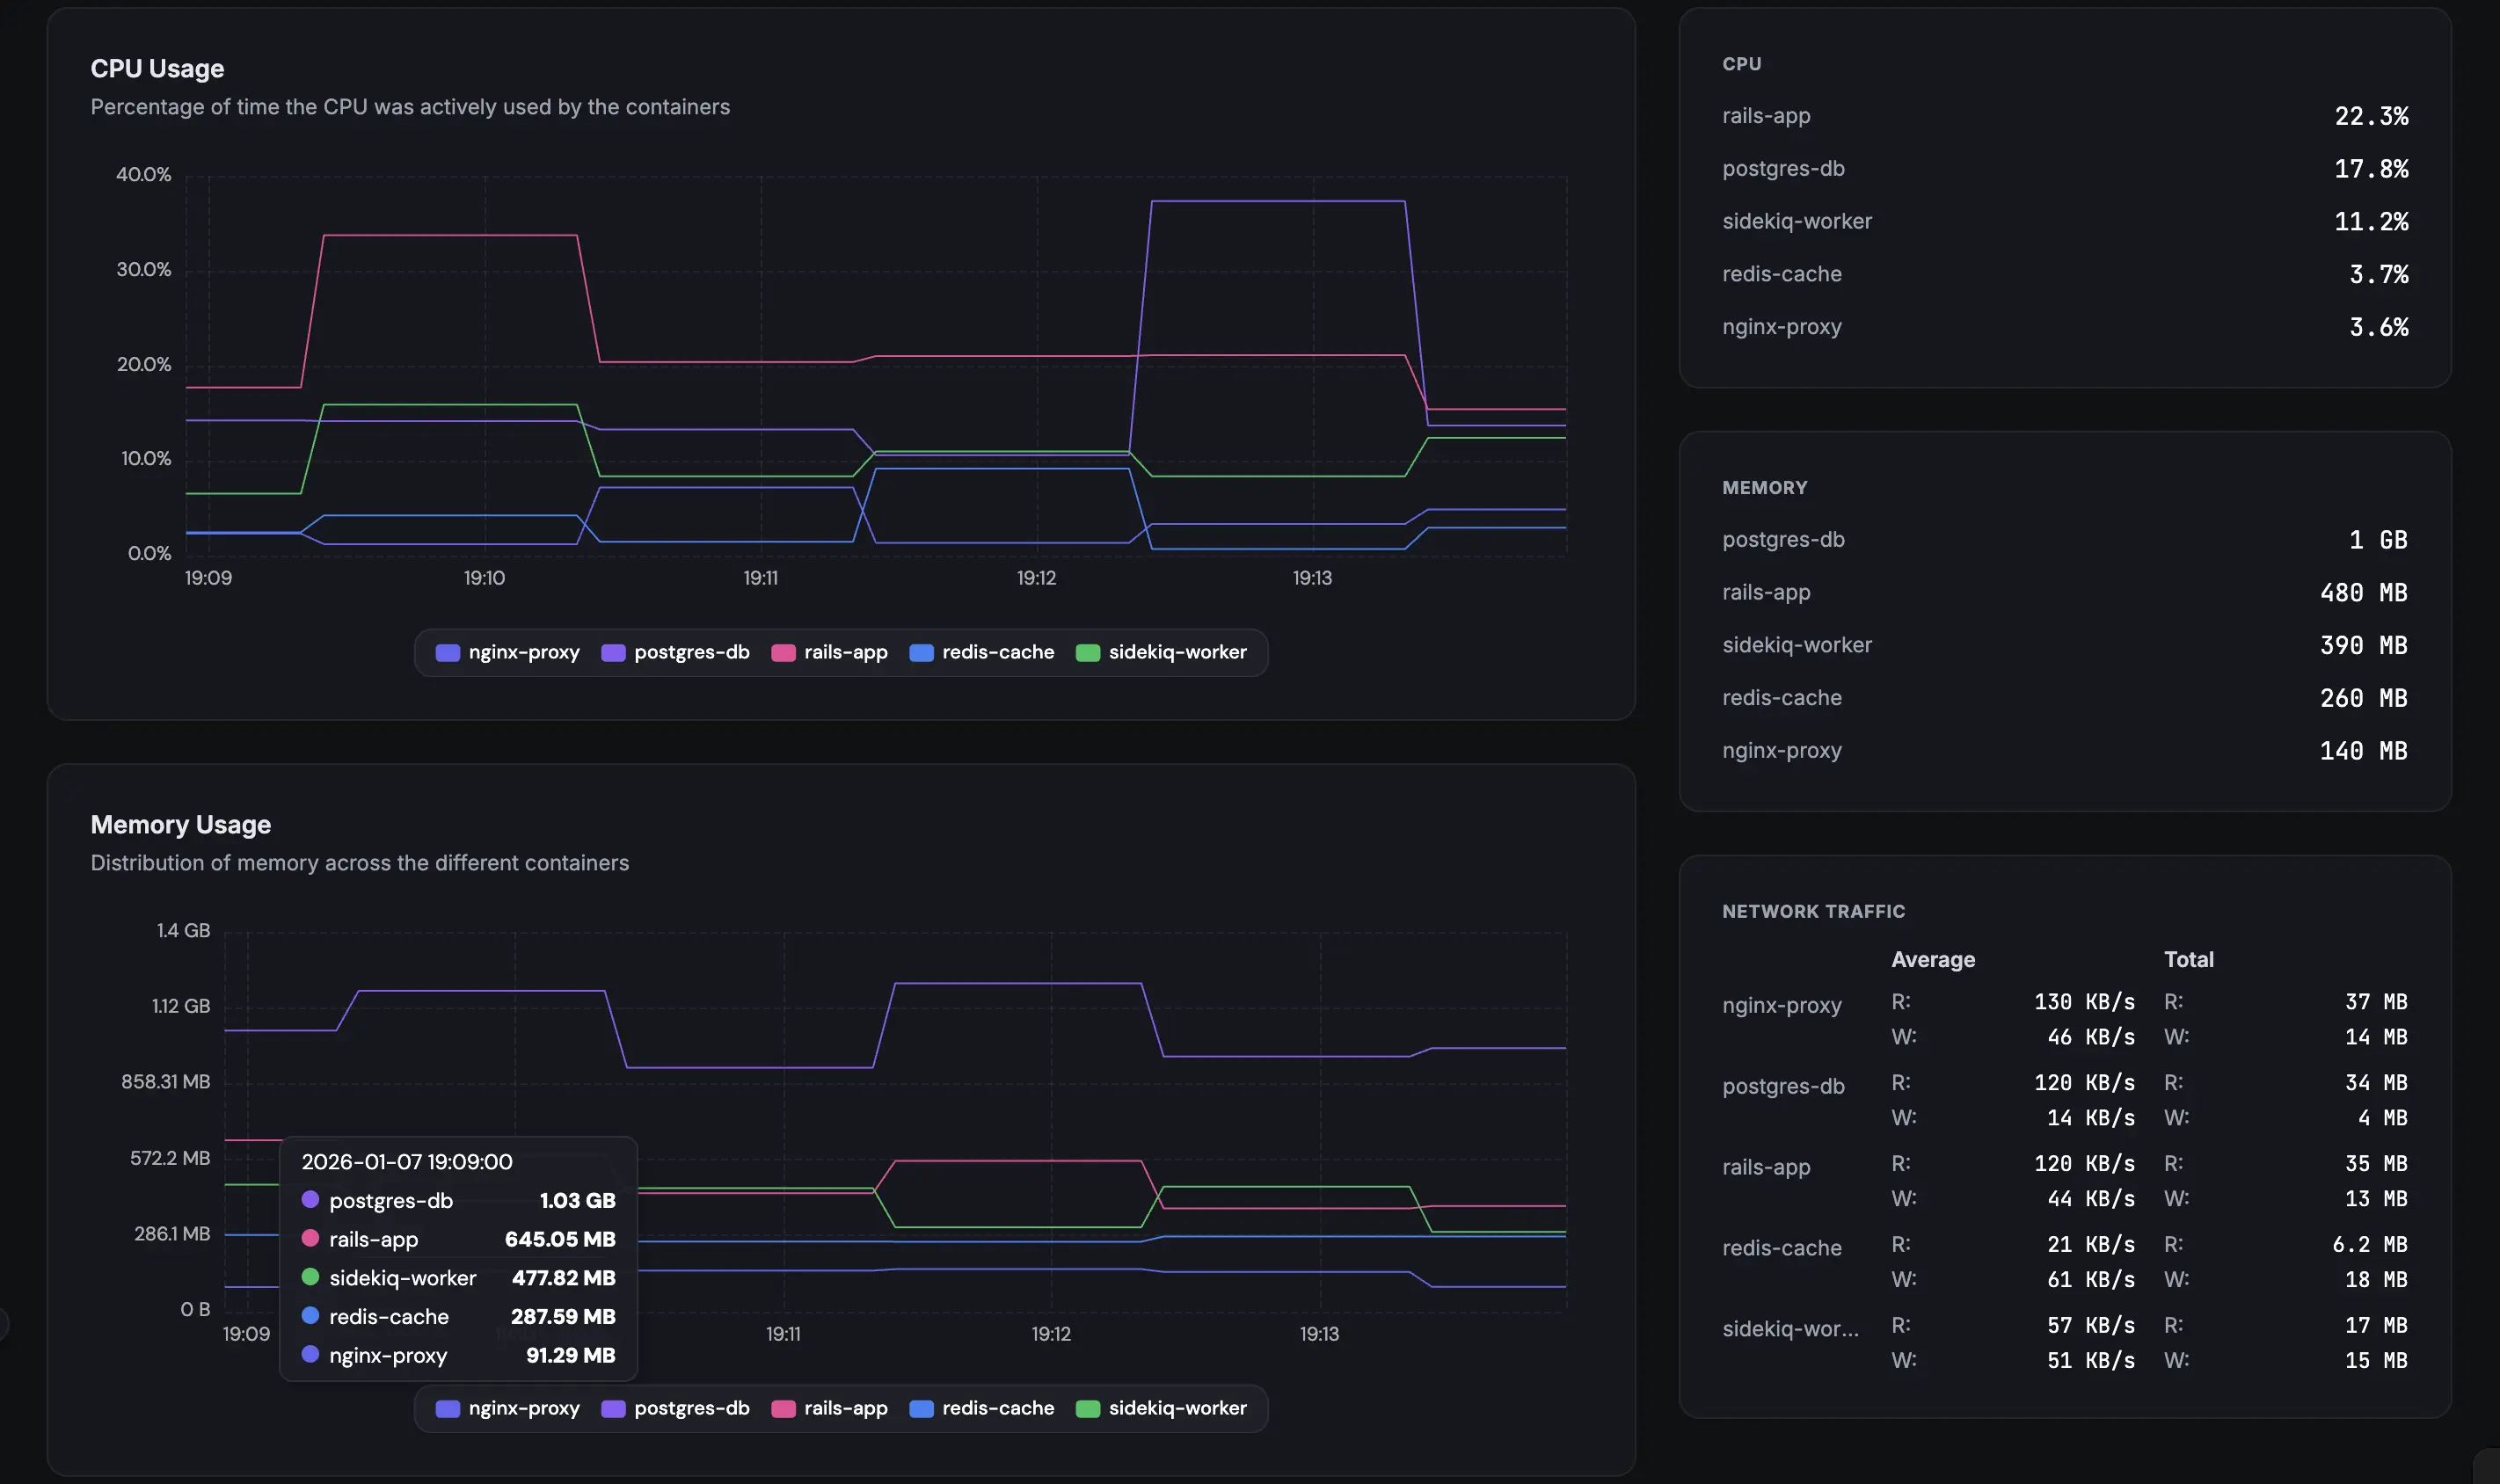
CPU, memory, network I/O and block I/O for every running container - individually, not just host-level aggregates - collected on a 60-second default interval and kept as history, not a live snapshot.
-
State, Not Just Graphs
Every container on the host, stopped ones included: running, exited, dead, restarting, paused - with the exit code, the OOM-killed flag and the HEALTHCHECK verdict beside it.
-
Image Vulnerability Scanning
Scan the OS packages inside your container images for known CVEs. One image running on fifty hosts is scanned once, and every affected host is listed against it.
Deep dive
The State a Graph Cannot Show You
A CPU chart stops at the moment a container dies and tells you nothing about why. Fivenines keeps a row for every container on the host, including stopped ones, and records what actually happened to it.
The container table carries the lifecycle state (running, exited, dead, restarting, paused), the exit code, an OOM-killed flag, the HEALTHCHECK verdict where one is defined, restart counts, and how long it has been in its current state.
So "exited (code 137, OOM killed)" replaces "the graph went flat". A container with no HEALTHCHECK reads as having none rather than as healthy - an absence of a signal is never reported as a good one.
Deep dive
Alerting on Container State, Per Container
Two dedicated triggers watch container state and open one incident per container, named after the container, so two dead containers on one host are two separate alerts.
Container down or unhealthy. Fires while a container sits in a watched state - exited, dead and unhealthy by default, with restarting, paused and created available - and resolves itself when the container recovers. Scope it to named containers or to an image substring so one-shot job containers that exit on purpose do not page you.
Restart loop. A crash-looping container reads "running" on every individual check, which is exactly why polling misses it. This trigger counts the restarts your restart policy performed inside a rolling window - three in sixty minutes by default, tunable up to twenty-four hours - and fires on the pattern rather than the snapshot.
Alerts go out over email, Slack, Microsoft Teams, Telegram, Discord, Pushover, PagerDuty or webhooks. Threshold alerts on container CPU, memory and network are also available; those evaluate the host's containers together, so use a max aggregate to catch the busiest one and reach for the two state triggers when you need the alert to name a container.
Deep dive
One Image, One Scan, Every Affected Host
A patched host running a two-year-old base image is not a patched system. With Docker monitoring on, Fivenines discovers every image your containers reference and scans the OS packages inside it against known CVEs - Debian, Ubuntu and Alpine layers today.
Findings belong to the image, not to each container. One image running on fifty hosts is one scan and one row, with the affected hosts listed against it, instead of the same CVE repeated fifty times. Images whose containers are stopped - or were never started - are scanned too, because a stale image is exactly the one nobody has looked at.
Nothing runs inside your containers. The agent asks the Docker daemon to stream the package database out of the image, so no shell, no docker exec and no binary inside the image is required - a shell-less image is fine, and so is rootless Docker. An image the scanner cannot read - no supported package manager, or a failed extraction - is reported as not scannable, with the reason, never as zero vulnerabilities.
Image scanning is available on Pro and above and needs a current agent.
Deep dive
Historical Data & Trends
Unlike docker stats, Fivenines stores your container metrics with 24 months of retention on every plan. Spot memory leaks that develop over days, correlate a restart with the memory spike that caused it, read block I/O as a read-versus-write split per container, and plan capacity based on real data.
How It Compares
| Approach | Setup Time | Per-Container | Container State | Image CVEs | Retention |
|---|---|---|---|---|---|
docker stats |
0 min | Live only | |||
| cAdvisor + Prometheus + Grafana | 2-4 hours | Manual config | Self-managed | ||
| Datadog | 30 min | Separate product | Expensive at scale | ||
| Fivenines | 2 min | Built-in | Pro and above | 24 months |
Setup Takes One Command
$ wget -qO- https://releases.fivenines.io/latest/fivenines_setup.sh | sudo sh -s ENROLLMENT_TOKEN
✓ Agent v2.x installed. Sending metrics to fivenines.io...
✓ [docker] Detected running containers. Metrics flowing in 60 seconds.
The agent auto-detects Docker and starts collecting container metrics and state immediately. No additional configuration needed. See your containers in the dashboard within 60 seconds of installation.
Beyond container metrics, Fivenines scans the OS packages inside your container images - and the host's own packages - for known CVEs, see vulnerability scanning.
Frequently Asked Questions
Does the agent run inside a container or on the host? +
What Docker metrics and container state are tracked? +
Does it work with Docker Compose and Docker Swarm? +
Can Fivenines scan my container images for vulnerabilities? +
Can I monitor containers across multiple servers? +
Explore next
Related Features
Vulnerability Scanning
CVE scanning for your host packages and the OS packages inside your container images.
Explore ->Server Alerts
Get notified via email, Slack, or Telegram when container state or metrics cross your thresholds.
Explore ->Custom Dashboards
Build dashboards combining per-container metrics with host-level data in a drag-and-drop builder.
Explore ->Proxmox Monitoring
Monitor Proxmox VMs, LXC containers, and hypervisor health alongside Docker.
Explore ->See how Fivenines compares to other tools
Read our guide to the best infrastructure monitoring tools in 2026.
Start monitoring your Docker containers in 2 minutes
14-day trial. No credit card required.
No credit card · 2-minute setup · Cancel anytime
How to build a complete monitoring stack with Docker Compose