Monitor the Whole Proxmox Cluster, Not One Node at a Time
A Proxmox node can show 40% CPU while individual guests fight for resources - and a cluster can lose quorum while every node looks fine. Install the agent on one node to watch the entire cluster: quorum, nodes, VMs, LXC containers and storage pools.
Built for teams monitoring production infrastructure
14-day trial · No credit card required
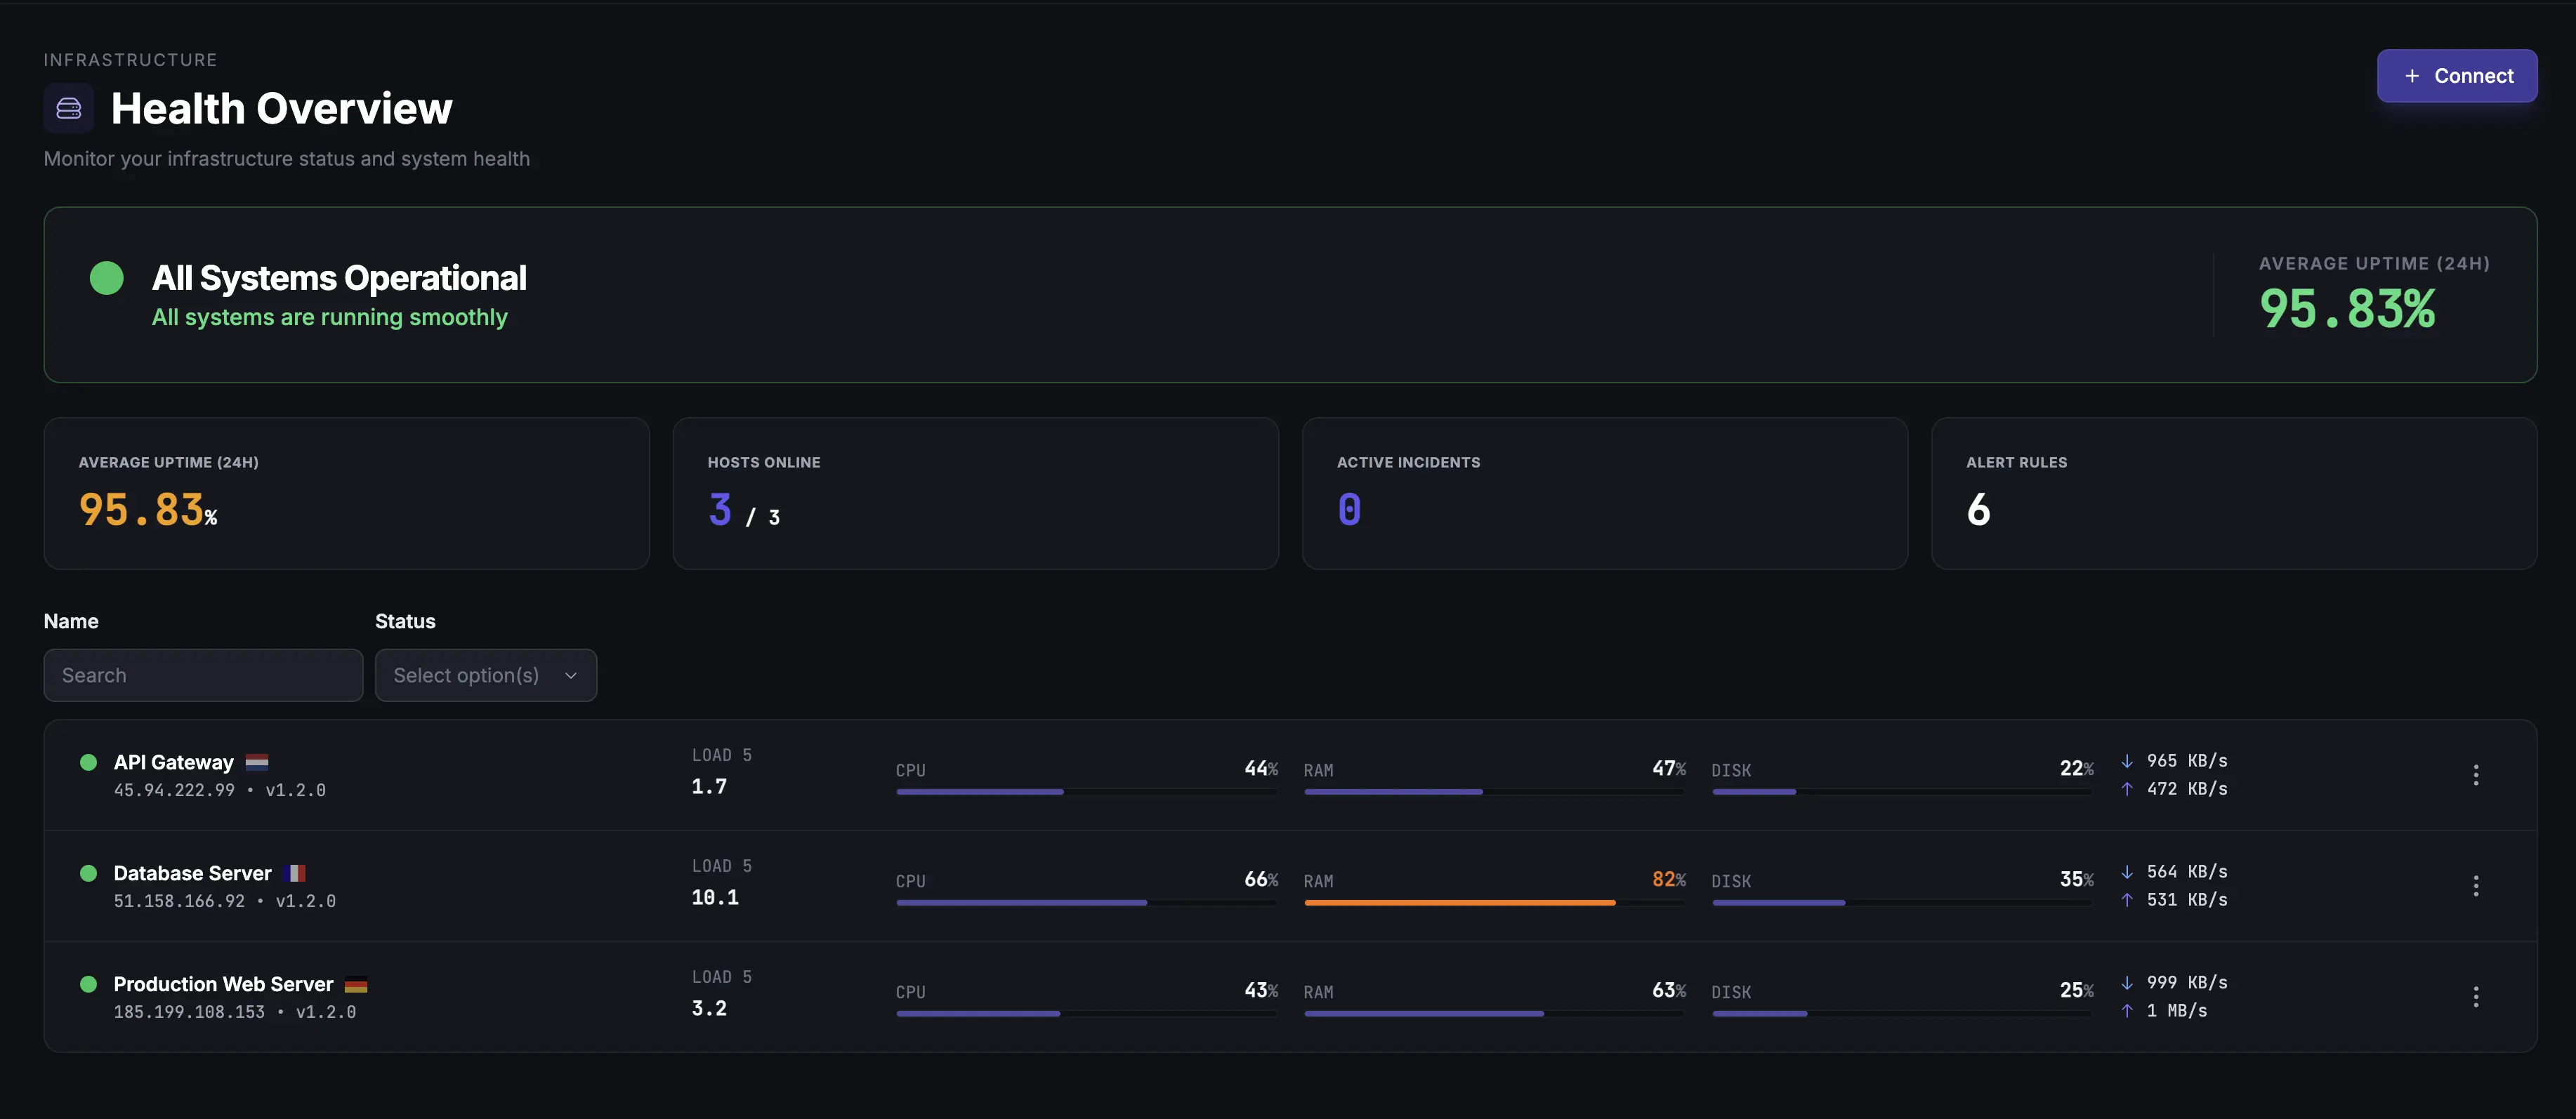
-
Cluster-Aware, Not Host-Aware
A Proxmox cluster is a first-class object here, not a per-host record - so one agent covers every node in it.
-
VMs, LXC & Node Metrics
Per-guest CPU, memory, disk I/O and network for both VMs and LXC containers, plus per-node CPU, RAM and running-guest counts.
-
Storage & RAID Health
Track pool capacity and active state across the cluster. On nodes running the agent, ZFS-backed pools also show the underlying zpool's health, and S.M.A.R.T. plus RAID catch failing drives.
Start With One Proxmox Cluster
- Connect one node. Install the agent on a Proxmox node, enable its Proxmox module and give it a read-only API token with the PVEAuditor role (the Proxmox API setup guide covers privilege-separated tokens). Done when the cluster shows up with all its nodes.
- Check the inventory. Compare the nodes, VMs, LXC containers and storage with Proxmox. Done when they match and the data is fresh.
- Test one alert. Stop a test guest under a workflow that notifies your channel. Done when both the alert and its recovery arrive.
After the pilot, add agents on other nodes for local disk health or redundant reporting, add your Proxmox Backup Server, and keep a separate check for each application running inside a VM.
VMs and LXC containers discovered through the Proxmox API do not count as monitors. Each host running the agent counts as one server monitor; uptime checks, cron tasks and other monitors share the same plan allowance.
Deep dive
One Agent Monitors the Whole Cluster
Point the agent at the Proxmox API with a read-only token and it reports the entire cluster - every node, guest and storage pool - not just the machine it runs on. Install it on more nodes and the extras become redundant reporters: the most complete one is authoritative, and if it goes quiet another takes over automatically, with no duplicate rows.
That changes what an alert means. A cluster losing quorum opens one incident, not one per reporting node. An offline node opens one incident for that node. A stopped guest opens one incident for that guest, and it keeps the same identity if the guest migrates to another node.
Your Whole Proxmox Fleet on One Page
Clusters overview
One card per cluster: quorum state, nodes online, guests running, storage pools active, and a freshness dot for each host reporting it.
Cross-cluster guest grid
Every VM and LXC container across every cluster in one table. Filter by cluster, node, type or status - and sort by live CPU, memory, disk or network.
Per-cluster charts
Nodes online, quorum, average node CPU, memory used against total, and running guests - over whichever time range you pick.
Deep dive
Every Guest Has a Recent Backup
The agent reads each guest's most recent backup and its age from the Proxmox node - across every storage it can see, local, NFS and PBS-backed alike - so you can answer the question that actually matters: has every critical VM and container had a successful backup in the last N hours? A guest past that age - or with no successful backup at all - raises its own alert, and any guest that sits in no backup job is flagged so it cannot slip through unnoticed.
It stays honest about what it cannot see: a storage the token cannot audit reads unknown rather than a false "never", and the backup-stale alert freezes instead of clearing while visibility is lost - so a missed read never looks like a fresh backup.
Deep dive
Proxmox Backup Server, Read Through Its API
What you see. Each datastore shows its usage and PBS's own estimated-full date, plus garbage collection. Each backup group shows its newest backup, its size, whether it is encrypted and whether it passed verification. Each sync, verify and prune job shows its last run, and charts keep the history. A group the latest collection did not read shows as last known, never as overdue, and a usage PBS did not report reads Unknown, never zero.
To connect it, add the backup server from the Proxmox area or from an instance's settings, and pick the agent that reads it: the one on the PBS host, or any other that reaches its API, with a read-only token limited to Datastore.Audit and Remote.Audit (PBS's built-in Audit role is too wide, and the agent refuses it). That answers what the Proxmox VE backup view cannot: is the latest backup intact, is the offsite copy still syncing, when will the datastore be full - and what about the machines Proxmox VE never sees, which back up to the same server.
What alerts. With the one-click Proxmox Backup Server Needs Attention workflow, an incident opens when the backup server can no longer be read. A failed verification or a filling datastore is shown, not alerted on. For verify, sync, prune and garbage-collection results, point PBS's own webhook notification target at a Fivenines task per job: success to the task's ping URL, errors to its /fail URL, and a job that has run before and then stops trips its task's schedule. A Task Failed workflow turns an error into an incident.
Deep dive
Process-Level Visibility
See which processes on the Proxmox host consume the most resources. Identify runaway QEMU processes, unexpected CPU consumers, or memory-hungry services competing with your VMs.
Deep dive
Alerting That Understands Clusters
Six Proxmox triggers cover the cluster from top to bottom: quorum lost, node offline, guest stopped, guest backup stale, storage pool inactive, and a per-guest metric threshold on CPU, memory, disk read/write or network in/out. All six triggers ship as one-click templates.
Node alerts fan out per node, so a cluster losing two nodes opens two incidents, each naming the node it is about - you know what to look at before you open anything. And putting the hosts into maintenance freezes that cluster's alerts rather than firing a false recovery when the work finishes.
Alerts go where your team works: email, Slack, Microsoft Teams, Telegram, Discord, Pushover, PagerDuty or webhooks.
Common Proxmox Monitoring Scenarios
Homelab
Watch a single node or a three-node cluster. Catch a lost quorum, a guest that failed to come back after a reboot, or a pool filling up before it bites.
Hosting provider
Track resource allocation across customer VMs and containers. Spot noisy neighbors, monitor storage pool health, and keep historical data for SLA reporting.
Managed service provider
Several customer clusters, one fleet page. Filter every guest by cluster, node or status, and hand a named node or guest straight to whoever is on call.
Customer story
“Fivenines helped us catch customer VPS that had been compromised and were running crypto-mining workloads. The signals, unusual disk I/O and sustained CPU, were there immediately. And because the agent only sends data outbound, deploying it across our infrastructure didn't require touching firewall or NAT rules.”

Fatih Gülsuyu CTO at Hosting.com.tr / Fastpanda
The agent runs on the KVM/Proxmox hypervisor node, so a customer VPS's CPU and disk I/O can surface even when that VPS has no agent of its own.
How It Compares
| Approach | What You Set Up | Cluster Health | VMs + LXC | Storage | Alerting |
|---|---|---|---|---|---|
| Proxmox Web UI | Nothing, built in | Built-in | Basic | Limited | Event notifications, no metric rules |
| Prometheus + Grafana | Exporter, Prometheus, Grafana | Exporter needed | Manual config | Manual config | Manual |
| Zabbix | Zabbix server + template | Official template | Per-guest items | Template-based | Supported |
| Fivenines | Agent + API token | Quorum + nodes | Supported | S.M.A.R.T. + RAID | Built-in |
Frequently Asked Questions
Does the agent run on the Proxmox host or inside VMs? +
Will it affect VM performance? +
Does it monitor Proxmox clusters? +
What storage backends are supported? +
Can I monitor Proxmox Backup Server? +
Explore next
Related Features
Infrastructure Services
The layer under the hypervisor - Ceph, RabbitMQ, HAProxy, systemd units and ZFS pools.
Explore ->Server Alerts
Quorum, node and storage alerts on state; per-guest metric thresholds; eight notification channels.
Explore ->Docker Monitoring
Monitor Docker containers running inside your Proxmox VMs.
Explore ->Custom Dashboards
Build unified views combining VM metrics, host data, and storage health.
Explore ->Cron Job Monitoring
Track backup scripts and scheduled maintenance tasks on your Proxmox nodes.
Explore ->See how Fivenines compares to other tools
Read our guide to the best infrastructure monitoring tools in 2026.
Monitor your whole Proxmox cluster from one agent
14-day trial. No credit card required.
Cancel anytime
Learn more: How to monitor Proxmox virtual machines · How to monitor KVM virtual machines · Best Proxmox monitoring tools in 2026