Website & API Uptime Monitoring
HTTPS, TCP, ICMP and DNS checks run from four probe regions - US East, EU West, Asia Pacific and Africa South. A monitor only goes down when enough regions agree, so a hiccup on one network path does not wake you at 3 AM. Alerts reach you on Email, Slack, Microsoft Teams, Telegram, Discord, Pushover, PagerDuty or webhooks.
Built for teams monitoring production infrastructure
No credit card · 2-minute setup
How It Works
Step 1
Configure Check
Pick HTTPS, TCP, ICMP or DNS, set the interval, and define what counts as a healthy response.
Step 2
Probes Check
Up to four regions check your service independently, each on its own schedule.
Step 3
Alert If Down
Once enough regions agree it is down, you're notified on your chosen channels.
Step 4
Create Incident
An incident is created automatically with a full timeline.
-
Four-Region Verification
US East, EU West, Asia Pacific and Africa South probe independently. Set how many must agree before a monitor goes down, and how many clean rounds call it recovered. If a region is unreachable, the threshold falls back to the regions still reporting, so a probe outage cannot freeze your monitor.
-
Slow Before Down
Every check records its response time per region. A dedicated trigger fires while a monitor is still up but answering slower than your threshold - the degradation you want to see before it becomes an outage.
-
SSL Expiry & Rotation
Get alerted a configurable number of days before a certificate expires - and again when one is replaced, so an unplanned certificate swap does not go unnoticed.
Deep dive
Four Check Types, and You Decide What Counts as Up
Monitor an HTTPS endpoint, a raw TCP port, an ICMP ping, or a DNS record (A, AAAA, CNAME, MX, TXT or NS) - all from the same four regions, with the same alerting behind them.
For HTTPS checks, "up" is yours to define. Set the expected status codes so an endpoint that answers 401 or 403 by design is treated as healthy instead of paging you every minute. Require a keyword in the response body - or alert when one appears, which is how you catch a page that returns 200 with an error rendered inside it. Send a GET, HEAD or POST with your own headers and body, choose whether redirects are followed, and pin the check to IPv4 or IPv6.
Deep dive
Six Things to Alert On, Not Just One
A hard outage is the obvious alert. Fivenines ships six uptime triggers, each a one-click workflow template: the monitor is down, it is slower than your threshold while still up, its availability has fallen below an SLA target over a rolling 24-hour, 7-day or 30-day window, its certificate is close to expiring, its certificate has just been replaced, or a DNS monitor's records have changed - the hijack, registrar-takeover and fat-finger alert.
Routing is yours to decide, and every trigger reaches the full set - Email, Slack, Microsoft Teams, Telegram, Discord, Pushover, PagerDuty and webhooks - so production endpoints can page PagerDuty while staging posts to a Slack channel. Alerts name the check that failed, which regions saw it, the response time and the HTTP status returned; the resolution notification carries the total downtime. Slowness, SLA and certificate alerts are deliberately kept out of your availability numbers, so an SSL warning never dents the uptime you report.
Deep dive
Response Time Graphs & Uptime History
Every check records the full response time, not just up/down status. Each monitor has a response-time graph broken down by region over any time range, so you can tell a slow origin from one slow network path - a gradually increasing response time often predicts an upcoming outage.
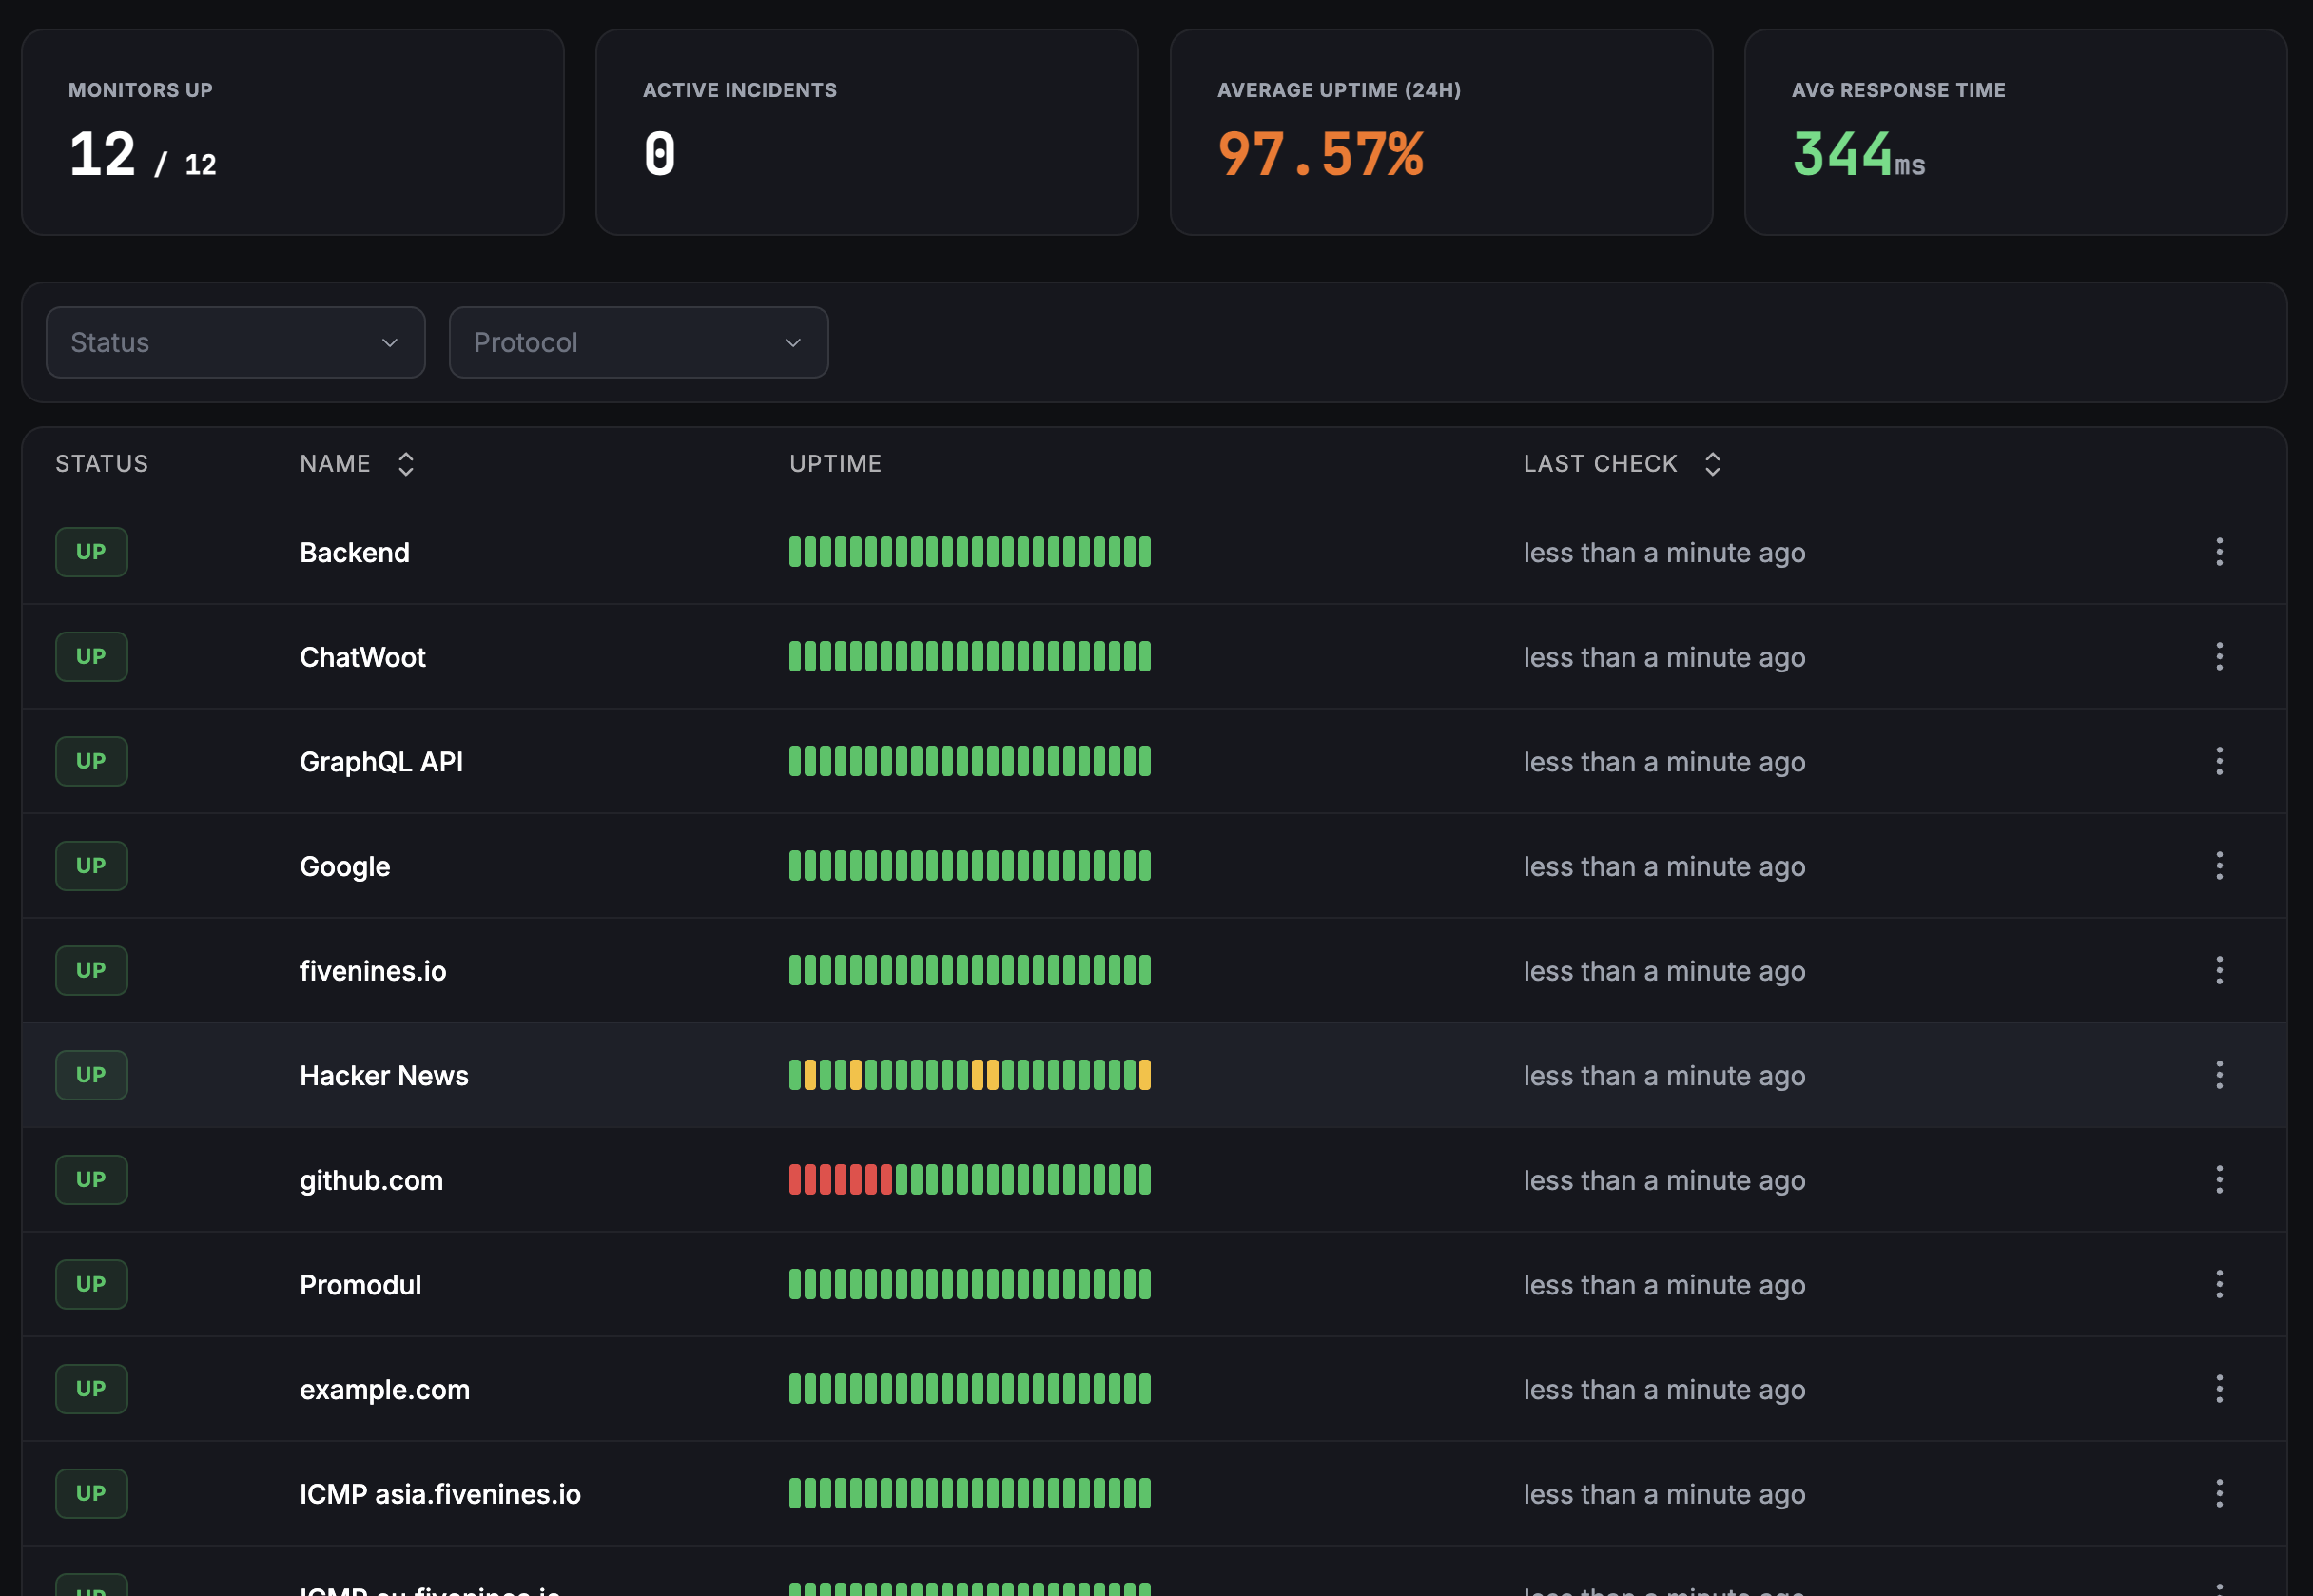
The monitor list shows the last 24 hours as an hourly strip. Longer-run availability is calculated from incident history and surfaces where you need it: on a public status page over 24 hours, 7, 30 or 90 days, on an embeddable badge, and as dashboard panels you can put next to your server metrics.
How It Compares
| Approach | Multi-Region | SSL Monitoring | Status Pages | Server Metrics | Cost |
|---|---|---|---|---|---|
| Manual Checking | Free | ||||
| UptimeRobot | Limited | $7+/mo | |||
| Uptime Kuma | Self-hosted | ||||
| Fivenines | Built-in | From €19/mo |
Included on all paid plans
Starting at €19/month
Channel availability varies by plan - see pricing.
Frequently Asked Questions
How does multi-region uptime monitoring work? +
What check intervals are available? +
Can I treat a 401 or a redirect as up? +
What can I be alerted on besides a hard outage? +
Can I display uptime data on a public status page? +
Explore next
Related Features
Status Pages
Share real-time uptime data with your users on a branded public status page.
Explore ->Server Alerts
Combine uptime monitoring with server-level metric alerts for complete coverage.
Explore ->Custom Dashboards
Build dashboards combining uptime data, response times, and server metrics.
Explore ->See how Fivenines compares to other tools
Read our guide to the best infrastructure monitoring tools in 2026.
Start monitoring your websites and APIs in 2 minutes
14-day trial. No credit card required.
No credit card · 2-minute setup · Cancel anytime